Response Spectrum
Two alternative programs for response spectrum are given here . One of these is based on the algorithm given by N.C.Nigam and P.C. Jennings (Bulletin of the Seismological Society of America, Vol.59, 1969, pp 909-922) and the other by D.A.Gasparini and E.H. Vanmarcke (MIT, Department of Civil Engineering, Report No. R76-4,1976). The program for generating Spectrum compatible accelerograms is based on the Fortran program of the above mentioned MIT report.
Earthquake response spectrum has its origin in earthquake engineering, and determines the influence of the earthquake vibrations on an engineering structure. Under the influence of earthquake vibrations the base of a structure, partially embedded in the ground, tends to move with the ground. The rapid ground motion produces stresses and deformations in the structure. These deformations vary in different parts of the structure. A rigid structure tends to move with its base, so that the dynamic forces on the base and elsewhere in the structure are nearly equal. To prevent damage from differential movements in the structure, it must be designed to withstand the forces of deformation. It should be able to absorb energy and dissipate it through vibrations, damping or inelastic deformations. Response spectra are the tools used to describe the effect of the structure to the earthquake vibrations. These are defined in terms of the maximum responses of a set of single degree of freedom (SDOF) systems characterized by their natural frequencies and damping ratios, when each oscillator is subjected, independently, to the vibration at its base. (The number of independent coordinates required for specifying the configuration or position of a system is referred to as the number of degrees of freedom. A single degree of freedom system can, thus, be completely defined using only one spatial coordinate.) With suitable modifications to the response spectra to account for the effects of local geology in modifying the earthquake vibration these are used for earthquake resistant (or aseismic) design of structures . For understanding earthquake response spectrum the response of the SDOF to the earthquake ground motion must be understood.
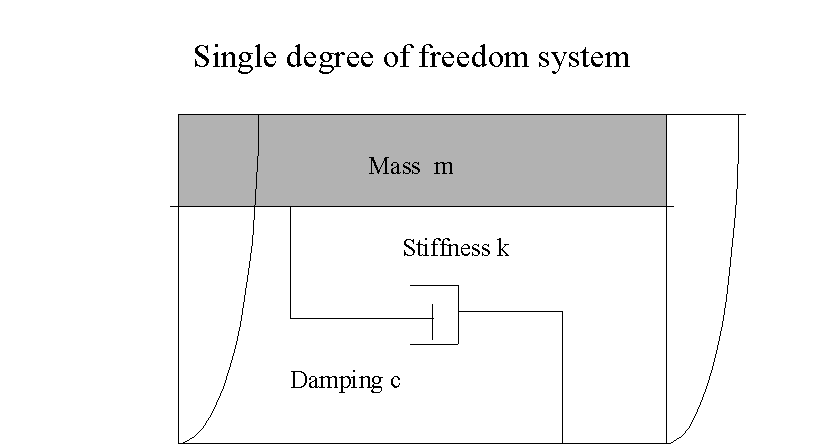
Single
Degree Of Freedom System
The
figure given below shows a very simple structure. Here mass less elastic columns
CE and DF support a slab ABCD of mass m. The
elastic columns are characterized by a spring constant k.
When subjected the earthquake ground motion the structure deviates from
its original position, as shown in the figure, and dissipates energy due to
internal damping proportional to velocity of the mass. The constant c represents
the damping in the structure. In the treatment given below the displacement of
base of the structure in the horizontal direction is represented by ug(t)
and the horizontal displacement of the slab by u(t) .The slab is in equilibrium
under three different forces, namely:
(a)
The inertial force fI = m (d2u/dt2 +d2ug/dt2),
(b)
The spring force fS =k u, and
(c)
The damping force fD = c (d2u/dt2).
In the equilibrium state fI + fD+ fS=0.
This condition gives the equation of motion during the earthquake vibration.
m (d2u/dt2)
+c (du/dt) +k u =-m(d2ug/dt2)
or
d2u/dt2 +2wx
(du/dt). +w2u
= -d2ug/dt2… (1)
Here
w=
Ö(k/m) and x
= c/2Ö(km)
This
structure is a single degree of freedom (SDOF)
system of natural frequency w
and damping c. For any given earthquake displacement time history ug(t)
the equation of motion can be solved for u(t) at any specified frequency and
damping. For each time history, and for a specified frequency and damping value,
a maximum value umax of u(t) can be determined, where umax
represents the value of the maximum displacement of the slab with respect to its
original position. A plot of umax against frequency is called displacement response spectrum of the earthquake. The ordinates of
this plot are called spectral
displacement, and are represented by SD(w,x).
Thus for any frequency and damping value
SD
=max |u(t)| … (3)
The
maximum spring force is the given by:
fS
= k umax … (4)
The
spring force can also be visualized as a pseudo inertial force on the mass m, so
that
fS
= ma … (5)
Here
`a’ is pseudo absolute acceleration. From equations (4) and (5) one gets a = umax.
At high frequencies the maximum value of `a’ during the vibration may be
obtained from Equation (1). This turns out to be w2u.
The pseudo absolute acceleration (PAA) is represented by the symbol SA.
SA=
uamax =w2u
… (6)
SA
is called the spectral acceleration. The maximum strain energy in the
spring equal to (1/2) k SD2. This can be associated with a
velocity SV, such that the kinetic energy associated with it is equal
to the maximum strain energy, i.e.
(1/2)
m SV2 = (1/2)k SD2…(7)
Thus
SV = w
SD … (8)
SV
is also a pseudo velocity because it is not related to the actual velocity
of the structure. Thus the three different spectral ordinates are related with
each other as follows:
SA
= w
SV = w2SD….
(9)
Figure - Single Degree of Freedom (SDOF) system subjected to Earthquake Vibration.
On account of the relationship between the three types of the spectral ordinates all the three spectra can be plotted on a single tripartite plot.
From
the relation between the three components of spectral motion we have
SV
= (2pf)
SD
or
Log 10 (SV) = Log 10 (f) + Log 10 (2pSD)
For
constant values of SD this equation represents a straight line of Log10
(SV) versus Log 10 (f) with a slope of 45°.
Similarly
SV
= SA/(2pf)
or
Log 10 (SV) = -
Log 10 (f) +Log 10 (SA/2p)
For
constant values of SA this represents a straight line of Log 10 (SV)
versus Log 10 (f) with a slope of 135°.
This page was updated on January 12, 2011