
Windows
Extended Application For Earthquake data
(R.
D. Sharma)
In addition to the five major items described in the starting window the application contains a Tools menu, which can be used to meet general computational needs of the user in meeting miscellaneous data processing needs. When the item Tools is clicked on the Windows menu the Tools menu pops up as shown below:

The application uses the QuakeLib dynamic link library (DLL). The files QuakeLib.lib and QuakeLib.dll must exist in the same folder, where the application is residing.
Ground motion data are continuously monitored at the seismological arrays of the U.K.A.E.A. (United Kingdom Atomic Energy Authority) at four different locations, namely: EKA (Eskdelemuir, Scottland) ,GBA (Gauribidanur, India),YKA (Yellowknife, Canada) and WRA (Warramunga, Australia). These data are edited for selecting events (earthquakes or underground nuclear explosions) and saved into binary digital files along with coded time information. The application reads event data from such files and decodes the coded ground motion data and time information before processing the data. The file names for these data have the extension .bin. The application also has a provision of generating synthetic data, where seismic arrivals are simulated as damped sine waves.
The application permits exclusion of any of he data channels from the process.
Processing of array data in the application is based on the principle of array beam-forming used for enhancing signal to noise ratio for data from arrays. Array beam forming is applied at the UKAEA type arrays by grouping the seismic traces recorded at the array in two groups, corresponding to the two rectangular arms of the array. The two groups are named as “RED” and “BLUE”, the names by which the array arms are identified. The traces in each group are added together with different time shifts. The time shifts correspond to the phase shifts suffered by the signal on account of its finite velocity and a definite direction across the array. Signal to noise ratio improvement in the processed output of the array results from the fact that when the outputs from all the sensors (seismometers) of the array are added, with proper time shifts, the signal is added in phase whereas the noise is added out of phase. The improvement in the signal to noise ratio depends on the propagation characteristics of the noise as well as the signal across the array. The basic objective in array processing is, thus, to determine the time shifts that produce the desired improvement in the signal to noise ratio, and then to apply these to the various sensor outputs to produce the maximum signal to noise ratio. In the process, sensors of the array can also be assigned weights so that better quality records are given greater importance. The process of adding the array outputs with proper time shifts (and weights) is called beam forming. For a monochromatic signal traveling across an array with an apparent velocity Va the phase shift at a sensor location characterized by the coordinates (Rm, am) – where Rm is its radial distance from the origin of the coordinate system and am is its angle from the initial line – may be written as:
bm = 2pRmCos(q-am)/lVa
Here l is the apparent wavelength of the signal and q is the azimuth (angle measured anticlockwise from north) of its source. The relative arrival times of the signal at the mth sensor are, then, given by:
tm = Rm. k0/f
In this f is the frequency of the signal and k0 is a
vector pointing in the direction of the incoming signal wave front. The arrival
of a seismic signal wave front and the location of the sensor characterized by (Rm,am) is illustrated in the
figure below. The phased output of the array at the nth point, in a digitized
set of N seismic signals is given by:
O(n) =S Im (n + jm) , m=1,2,3,…..N
In this Im is the digitized seismic signal at the ith sensor and tm=jm.Dt, Dt being the sampling interval for digitization of the signal traces In array processing dt/dD is quite often referred to as slowness – measured in seconds per degree (thus, inverse of velocity). Azimuth is the angle which the direction of the incoming signal makes with the direction of the geographical north with respect to the center point (origin) of the array.
Based on the processes of array beam-forming, the application carries out the slowness-azimuth search in a three dimensional space (slowness, azimuth and array response), or, optionally, a slowness search along the trace for a fixed azimuth to detect multiple seismic arrivals in the seismic wave train. The three dimensional search is carried out in two steps. A coarse search is first carried out by varying the azimuth between 0 and 360 degrees in steps of 10 degrees in the azimuth and varying the slowness in steps of 0.3 seconds/degree. A fine search is then carried out about the parameters of the coarse search in steps of 1 degree in azimuth (18 degrees on both sides) and 0.1 seconds/degree in slowness (1.1 sec/degree on both sides). The process of the search is illustrated below:
Array Response For Azimuth (Z)and Slowness (dt/dD)
|
Z/dt/dD
|
13.0
|
12.7
|
12.4
|
12.1
|
11.8
|
11.5
|
11.2
|
10.9
|
10.6
|
10.3
|
10.0
|
9.7
|
9.4
|
9.1
|
|
110.0
|
.0
|
.0
|
.3
|
1.0
|
1.2
|
.6
|
.5
|
.7
|
.5
|
.7
|
.0
|
.3
|
.3
|
.0
|
|
111.0
|
.3
|
.2
|
.0
|
1.8
|
1.7
|
1.0
|
.2
|
.4
|
1.3
|
2.6
|
.2
|
.0
|
.3
|
.0
|
|
112.0
|
.0
|
.2
|
.2
|
1.6
|
4.2
|
1.6
|
.2
|
.1
|
.6
|
3.0
|
.1
|
.0
|
.3
|
.0
|
|
113.0
|
.0
|
.0
|
.1
|
.2
|
2.6
|
3.4
|
.5
|
.0
|
.3
|
3.0
|
.4
|
.0
|
.1
|
.0
|
|
114.0
|
.0
|
.2
|
.1
|
.5
|
1.5
|
3.0
|
.2
|
.0
|
.5
|
3.1
|
.2
|
.0
|
.3
|
.0
|
|
115.0
|
.1
|
.2
|
.3
|
.4
|
.9
|
3.0
|
.2
|
.0
|
.8
|
9.3
|
.3
|
.0
|
.4
|
.0
|
|
116.0
|
.2
|
.4
|
.6
|
.7
|
1.4
|
6.1
|
.7
|
.1
|
1.1
|
6.7
|
.1
|
.0
|
.0
|
.0
|
|
117.0
|
.3
|
.2
|
.9
|
3.0
|
10.2
|
6.3 |
1.1
|
2.4
|
1.5
|
5.8
|
.0
|
.2
|
.0
|
.0
|
|
118.0
|
.4
|
.2
|
2.1
|
6.7
|
16.7
|
6.2 |
1.0
|
2.0
|
1.9
|
4.7
|
.0
|
.0
|
.0
|
.0
|
|
119.0
|
.6
|
.3
|
1.0
|
3.9
|
12.3
|
39.9
|
8.8
|
.0
|
1.9
|
23.2
|
.2
|
.4
|
.4
|
.3
|
|
120.0
|
1.0
|
.7
|
.1
|
1.5
|
5.0
|
100.0
|
19.0
|
.0
|
3.8
|
66.1
|
2.8
|
.7
|
.7
|
.7
|
|
121.0
|
.3
|
.4
|
.1
|
.8
|
1.0
|
16.4
|
9.2
|
.7
|
.4
|
3.8
|
9.2
|
2.0
|
.8
|
.5
|
|
122.0
|
.0
|
.6
|
.1
|
1.3
|
2.7
|
9.4
|
10.0
|
1.0
|
.5
|
4.2
|
12.0
|
2.7
|
1.2
|
1.3
|
|
123.0
|
.0
|
.6
|
.1
|
1.3
|
2.7
|
9.4
|
10.0
|
1.0
|
.6
|
5.5
|
15.2
|
3.6
|
1.7
|
1.3
|
|
124.0
|
.0
|
.3
|
.3
|
.0
|
.4
|
1.6
|
4.6
|
1.8
|
.4
|
2.3
|
6.6
|
2.6
|
1.3
|
1.0
|
|
125.0
|
.0
|
.0
|
.0
|
.0
|
.0
|
1.0
|
2.3
|
1.5
|
.3
|
1.6
|
1.8
|
1.6
|
.7
|
.4
|
|
126.0
|
.0
|
.0
|
.0
|
.1
|
.0
|
1.3
|
.6
|
.7
|
.8
|
1.5
|
.6
|
.3
|
.6
|
.3
|
|
127.0
|
.0
|
.0
|
.0
|
.0
|
1.1
|
3.1
|
2.5
|
.0
|
.3
|
2.2
|
1.2
|
.4
|
.3
|
.4
|
|
128.0
|
.0
|
.0
|
.1
|
.0
|
.6
|
1.0
|
2.0
|
.0
|
.3
|
.8
|
2.4
|
.3
|
.4
|
.3
|
|
129.0
|
.0
|
.0
|
.0
|
.0
|
.4
|
1.0
|
4.4
|
.1
|
.3
|
1.1
|
2.2
|
.2
|
.2
|
.2
|
|
130.0
|
.0
|
.1
|
.0
|
.0
|
.3
|
.7
|
2.9
|
.3
|
.0
|
1.1
|
1.5
|
.7
|
.1
|
.0
|


In this table the slowness decreases from 13.0 seconds/degree to 9.1 seconds/degree in steps of 0.3 seconds/degree. The azimuth increases from 110.0 degrees to 130.0 degrees (from the top downwards). Each of the other entries in the table shows the summed array output (normalized to 100) for the block of data in which the signal is present. It can be seen that the array output shows two peaks (marked in bold face). These correspond to two signals at 120 degrees azimuth: one with slowness of 11.5 seconds per degree and the other at slowness of 10.3 seconds per degree.
The measured slowness is used to estimate the distance of the epicenter from the center point of the array using the JB tables. From the distance and azimuth estimates the latitude and longitude of the epicenter are estimated to give the source location.
After each step of the three
dimensional search (the Coarse and the Fine searches) the geographical
region (as per the list given by Flinn and Engdahl , in which the
epicenter lies, is determined and displayed. Magnitude of the earthquake as seen
by the array is estimated, and displayed on the plot of the array beam.
Non linear processing produces better accuracies in slowness measurements The Nth root process is one of the several nonlinear methods, which is most suitable for digital processing. Here, an Nth root (where N=2,4,8….) is taken of the absolute value of the seismic signal amplitudes before summing the array out puts, and the amplitudes of the array sums are then raised to the Nth power. The application allows to use N =1,2,4,8 - - . When N is equal to 1, it is linear processing. The process is implemented through the sqrt function in the computer software.

Most of the results of analysis are stored in
files. The user is informed about the names of these files during execution.
These names can be changed, if the user so desires.
For processing array data the array data files with extension .bin are copied in the directory containing the SeismoXP.exe execution module. The dynamic link library (DLL), quakelib.dll should also be copied in this directory. The application is initiated either by entering the command line mode (DOS prompt) and typing SeismoXP on the command line, or by double clicking the applications icon. The application opens with the Window shown in the beginning. Clicking the Arrays item on the applications menu bar opens the array processing menu as shown below:

To begin with the array, for which the data are to be processed is selected by clicking the at the name of the array. On clicking on the array name the application responds by giving the details of the selected array, namely: name of the array selected and latitude and longitude and elevation of the center point of the array as shown below.

After the array is selected, and its parameters as listed by the applications window are verified, array data are cleared by choosing this item on the pop-up menu. In this pop-up menu options are available for checking delay calculations (delays suffered by a signal of known apparent phase velocity traversing the array from a specified direction), and also for generating synthetic data. Prior to array data processing some array processing parameters are set. Clicking the item Set Processing Parameters opens a dialog box as shown below:

After the array is selected, and its parameters as listed by the applications window are verified, array data are cleared by choosing this item on the pop-up menu. In this pop-up menu options are available for checking delay calculations (delays suffered by a signal of known apparent phase velocity traversing the array from a specified direction), and also for generating synthetic data. Prior to array data processing some array processing parameters are set. Clicking the item Set Processing Parameters opens a dialog box as shown below:

Here Beam Slowness and Beam azimuth are the slowness (sec/deg) and azimuth of the source for which the array beam will be formed. Since, delays have to applied in summing the array outputs for beam formation, an initial offset is used so that enough numbers become available for formation of the array beams. A standard array beam representation is shown below:

Prior to processing the array data, it is recommended that the data are the individual signal traces are examined to determine if there area any traces which are not of acceptable quality. This is done by examining the single channel plots (obtained by using the data processing menu). A typical single channel plot is shown below:

The channel numbers for the ones to be excluded are noted on a piece of paper, and the item “Set Channel Exclude Flags” is clicked on the Array pop-up menu. This will open a dialog box as shown below:

This dialog box contains a one for all channels, which are included in data
processing. For the channels, which are to be excluded in data processing, the
flag is changed to –1 from 1. After clicking OK a display of the single
channel plots, the single channel plot window will show a straight line for the
plot of the excluded channel (zero
values for the amplitudes).

These items are self explanatory. The “Clear Data Section” item on the expanded menu may be utilized to zero a selected portion of the array data in order to emphasize the remaining section of the data. The “Slowness-Azimuth Search” item, again expands into another submenu, the items on which are in accordance with the explanations given earlier. The results of a coarse search and the corresponding TAPM matrix are shown below:


After the coarse search is completed one goes for the Fine Search. The results of the fine search and its corresponding TAP matrix are shown below:


A graphical representation of the above listed measurements is shown below:

This application deals with the seismicity of areas within the Indian region. When the menu item “Earthquake Data” is clicked on the main menu of the application, the Earthquake Data menu pops up as shown below:

On selecting output files and input data files, the respective dialog boxes appear as shown below:
 |
 |
The results of the various stages of the application are stored in ASCII files. During execution the user is informed about the names of the various output files used by default. These names can be changed if the user wants to do so.
On Selecting Select Events the select events menu pops up as shown below:

Five ASCII files containing earthquake data (origin time, hypocentral and magnitude data on earthquakes within and around India) are included with the application. The Files are:
(1) EQTO64.DAT
(2) EQ65_76.DAT
(3) EQ77_89.DAT
(4) EQ90_99.DAT
(5) EQ2k.DAT
While the contents of Files (1) to
(4) are frozen, until some additional information becomes available to call for
any revision, File EQ2k.DAT will be
continuously updated periodically to add data of recent times.
As can be seen from the
applications menu the following choices are available for selecting events from
the data files.
1) Listing all events in the file.
2) Listing events within specified values of latitudes, longitudes, magnitudes and years.
3)
Listing events of specified
parameters as in 2, but within a specified distance from a specified site.
Selection of events is carried out by using the dialog box, which appears after the event selection choice is made. The dialog box is of one of the two types shown shown below:
 |
 |
The dialog box shown on the left hand side appears when events are selected within a region bound by specified values of latitude and longitude. The dialog box on the left hand side appears when events are selected within a specified radius from a location. It is presumed that such a choice will be made when events are listed to investigate the seismicity of a region, in which a site of interest lies. In this case values of peak ground acceleration (PGA) estimated at the site for each of the earthquakes, and is listed. The PGA is estimated using one of the sixteen empirical relationships, specified by the user through the dialog box shown below. (This dialog box appears automatically when the choice of selecting events within a radius is made).

The windows containing the event lists in the two cases are illustrated below.


The table above, which lists the
events within a specified distance from a site, includes two columns in addition
to the one listing events within the specified latitudes and longitudes. These
columns are distance of the earthquake from the center point and the estimated
value of the PGA at the site.
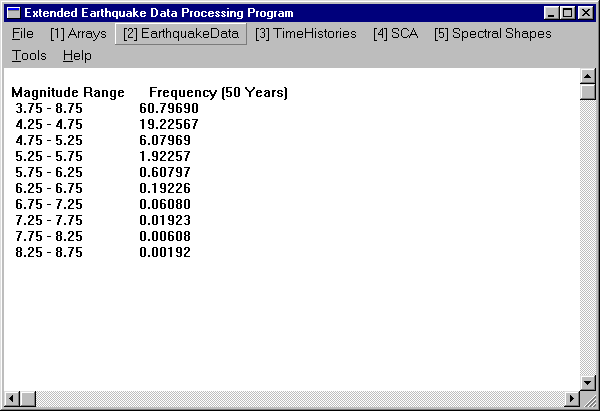
Seismicity for a region is expressed in terms of the number of earthquakes of different magnitudes occurring in the area over a 50 years period. The estimates are based on the magnitude frequency relation in the form:
Log (N) = A-bM
The values of the parameters A and b are either estimated on the basis of the earthquake data contained in the files, or are specified by the user. (When the user selects “Fix A and b values, a dialog box appears asking for these values, the A value is normalized for a circular area of 300 km radius).
Values of peak ground acceleration (PGA) are calculated using any one of 16 empirical relationships between earthquake magnitude and hypocentral parameters.
Felt area of an earthquakeis estimated as the radius of the area, within which specified values of PGA are exceeded, using a selected empirical relationship for estimating the PGA values at the site from the focal parameters of the earthquakes of different magnitudes. The “Felt Area Table” is illustrated in the following figure.

Earthquakes and earthquake effects are controlled by many unknown factors, not always allowing applications of deterministic methods of analysis. Some of these can be treated statistically. The probability of an area being struck by an earthquake is often referred to in engineering applications. The concept is illustrated below.
Suppose an earthquake occurs in an area A. Consider a small area a
in A. Let the area a
be, further, made of very small areas Da
in it, so that SDa
= a. Let us
call a specified location hit by an earthquake if the peak value of the ground
acceleration there exceeds a certain specified value.
Let the probability of none of the areas Da
being hit by the earthquake be written as p (0,a).
The probability of another smaller area Da
outside not being hit by the earthquake may be written as:
p (0,
a+Da)
= p(0,a).p(0, Da)
= p(0,a).(1- Da/A)
or
(1/ Da
).[p(0,a+Da)-p(0,a)] +(1/A).p(0,a)=0
Letting
Da
-> 0 this equation becomes
dp/da
+ (1/A).p =0
The
solution of this equation is given by:
p(0,a) = e –a/A
The
probability that the area a will be hit by the earthquake is, then,
given by
p(1,a)
= 1 - e –a/A
This
is the expression for probability in space. A similar expression for probability
can be derived, by analogy, in the time domain. The probability of the
earthquake hitting during a time interval of D years (where D years may be the
life of the engineering structures in the area) may be written as:
p(1,D)=1-e-D/T
Equating the two expressions of probability one gets the return period
of the event, having a probability of occurence, p(1,a), during an interval of
D years :
T
= -D/[Loge {1 – p (1,a)}]
In statistical analysis it is often assumed that the number of earthquakes in year is a Poisson variable and the earthquake magnitude, x, is a random variable with cumulative density function F (x) = Pr (X £ x) =1 –e -bx; x ³0. In this model the probability, RD of an earthquake of magnitude M in D years is given by:
RD
= 1 –Exp. (-aDe-bM)
Here a
and b are constants related to the seismicity
parameters specified by the earthquake magnitude frequency relationship,
namely:Log 10 N (M) = a-bM
Where N (M) is the number of earthquakes occurring annually in the
region and having magnitudes equal to or greater than M, and a = Log 10
N (0) and b the constant b determines the distribution of magnitudes in the
earthquake population. (see
Frequencies of Earthquake occurrence 4.3
).
a
= Exp. [a Log e10] and b = b Log e 10
Results of a typical calculation are shown in the Figure below:

Probabilities of Earthquakes of Different Magnitude in an area of Moderate Seismicity (a=4.0, b=1.0 for a 300 kilometers radius) over a period of 100 years.
This application analyses Ground Motion time histories (accelerograms) to determine ground motion parameters, which are of interest in aseismic design of engineering structures. On clicking the item “Time Histories” on the main menu the Time History menu pops up as shown below:

Execution of the application to analyze the time history of ground motion of an earthquake requires reading the accelerogram from an ASCII data file. The application, then, provides displays of the acceleration, velocity and displacement of the ground motion as a function of time. A list of the values of these parameters may be obtained by clicking on the menu item “Adv List”. Some parameters of ground motion, e.g. the peak values of acceleration, velocity and displacement (a, v and d), number of zero crossings per second and the value ad/v2 are listed. Response spectrum and power spectral density (PSD) of the ground motion are computed and displayed as and when selected on the pop up menu. The value of the dynamic amplification factor (DAF) can also be computed for any (and as many as) specified frequency.
 |
 |
 |
The time history of the ground motion of an earthquake is a description of the earthquake vibration as a function of time. Acceleration, velocity and displacement of the ground motion are related to each other through the frequency of the ground motion. Given the time history of one of these components the other two of ground motion the time histories of the other two components can be derived through the mathematical processes of integration or differentiation. However, because of the difficulty in determining the slopes in the high frequency waveforms differentiation of the displacement and velocity time histories does not provide accurate results. Integration of accelerograms is, therefore, preferred for deriving velocity and displacement time histories. A digitized accelerogram can be easily integrated numerically to get the other two time histories of ground motion. The computation procedure, which is used to derive velocity and displacement from a given accelerogram is describe below:
Let a0, v0 and x0 be the values of the ground acceleration, velocity and displacement at time t. Let a1 be the ground acceleration at time (t + h), where h is a small time interval during which the ground motion may be considered linear.
Thus a (t + h) = a (t) + a (t + h –h) = a0 + a h
At time t the acceleration can be written as
dv/dt =a(t) = a0 +a (t-t); t < t < t +h
Here v is the velocity. Integrating with the initial condition v(t) =v0 one gets:
t
v(t) = v0 + ò [a0 + a (t -t)]dt
t
t
v(t) = v0 +a0(t -t) +a ò (t -t)]dt
t
v(1) =v0 +a0h +(1/2) ah2
= v0+(h/2)(a0+a0+ah)
=v0+(h/2)(a0+a1)
To obtain the displacement one writes
dx/dt = v0
+a0(t-t)
+(1/2) a(t-t)2
Integrating with the initial condition, namely x(t)=x0 one gets
x (t)
= x0 + v(t
-t) + (1/2)a0(t-t)2
+ (1/2).(1/3) a(t-t)3
= x0 + v0h + (1/2)a0h2 + (1/6) ah 3
= x0 + v0h + (h2/6)(3a0 + ah)
x (1) = x0 + v0h + (h2/6)( 2a0 + a1)
The figures below show a synthetic accelerogram and the ground velocity and displacement time histories derived from the acceleration time history using the equations given above.
 |
 |
Earthquake response spectrum has its origin in earthquake engineering, and determines the influence of the earthquake vibrations on an engineering structure. Under the influence of earthquake vibrations the base of a structure, partially embedded in the ground, tends to move with the ground. The rapid ground motion produces stresses and deformations in the structure. These deformations vary in different parts of the structure. A rigid structure tends to move with its base, so that the dynamic forces on the base and elsewhere in the structure are nearly equal. To prevent damage from differential movements in the structure, it must be designed to withstand the forces of deformation. It should be able to absorb energy and dissipate it through vibrations, damping or inelastic deformations. Response spectra are the tools used to describe the effect of the structure to the earthquake vibrations. These are defined in terms of the maximum responses of a set of single degree of freedom (SDOF) systems characterized by their natural frequencies and damping ratios, when each oscillator is subjected, independently, to the vibration at its base. (The number of independent coordinates required for specifying the configuration or position of a system is referred to as the number of degrees of freedom. A single degree of freedom system can, thus, be completely defined using only one spatial coordinate.) With suitable modifications to the response spectra to account for the effects of local geology in modifying the earthquake vibration these are used for earthquake resistant (or aseismic) design of structures . For understanding earthquake response spectrum the response of the SDOF to the earthquake ground motion must be understood.
The figure given below shows a very simple structure. Here mass less elastic columns CE and DF support a slab ABCD of mass m. The elastic columns are characterized by a spring constant k. When subjected the earthquake ground motion the structure deviates from its original position, as shown in the figure, and dissipates energy due to internal damping proportional to velocity of the mass. The constant c represents the damping in the structure. In the treatment given below the displacement of base of the structure in the horizontal direction is represented by ug(t) and the horizontal displacement of the slab by u(t) .The slab is in equilibrium under three different forces, namely:
(a) The inertial force fI = m (d2u/dt2 +d2ug/dt2),
(b) The spring force fS =k u, and
(c) The damping force fD = c (d2u/dt2).
In the equilibrium state fI + fD+ fS=0. This condition gives the equation of motion during the earthquake vibration.
m (d2u/dt2) +c (du/dt) +k u =-m(d2ug/dt2)
or
d2u/dt2 +2wx
(du/dt). +w2u
= -d2ug/dt2… (1)
Here w=
Ö(k/m)
and x
= c/2Ö(km)
This structure is a single degree of freedom (SDOF) system of natural frequency w and damping c. For any given earthquake displacement time history ug(t) the equation of motion can be solved for u(t) at any specified frequency and damping. For each time history, and for a specified frequency and damping value, a maximum value umax of u(t) can be determined, where umax represents the value of the maximum displacement of the slab with respect to its original position. A plot of umax against frequency is called displacement response spectrum of the earthquake. The ordinates of this plot are called spectral displacement, and are represented by SD(w,x). Thus for any frequency and damping value
SD =max
|u(t)| … (3)
The maximum spring force is the given by:
fS = k umax … (4)
The spring force can also be visualized as a pseudo inertial force on the mass m, so that
fS = ma … (5)
Here `a’ is pseudo absolute acceleration. From equations (4) and (5) one gets a = umax. At high frequencies the maximum value of `a’ during the vibration may be obtained from Equation (1). This turns out to be w2u. The pseudo absolute acceleration (PAA) is represented by the symbol SA.
SA= uamax
=w2u
… (6)
SA is called the spectral acceleration. The maximum strain energy in the spring equal to (1/2) k SD2. This can be associated with a velocity SV, such that the kinetic energy associated with it is equal to the maximum strain energy, i.e.
(1/2) m SV2
= (1/2)k SD2…(7)
Thus SV
= w
SD … (8)
SV is also a pseudo velocity because it is not related to the actual velocity of the structure. Thus the three different spectral ordinates are related with each other as follows:
SA = w
SV = w2SD….
(9)
On account of the relationship between the three types of the spectral ordinates all the three spectra can be plotted on a single tripartite plot.
From the relation between the three components of spectral motion we have
SV = (2pf)
SD
or Log 10 (SV) = Log 10 (f) + Log 10 (2pSD)
For constant values of SD this equation represents a straight line of Log10 (SV) versus Log 10 (f) with a slope of 45°. Similarly
SV = SA/(2pf)
or Log 10 (SV) = - Log 10 (f) +Log 10 (SA/2p)
For constant values of SA this represents a straight line of Log 10 (SV) versus Log 10 (f) with a slope of 135°.
For a given accelerogram a (t) its Finite Fourier Transform (FFT) at angular frequency w is written as: FS (w) = [U2+V2] ½ ….. (1)
T
U = ò a(t) Sin (wt).dt ……. (1a)
0
T
U = òa(t) Cos (wt).dt ……. (1b)
0
Here T is the duration of strong motion. The Fourier amplitude spectrum FS (w) is written as the square root of the sum of squares of the real and imaginary parts, U and V, of F (w). FS (w) has the units of velocity. For an undamped SDOF system subjected to the acceleration a(t) at the base the response of the SDOF system and the Fourier amplitude are closely related. The equation of motion of the undamped SDOF system is written as:
d2/dt2 + wn x =-a(t) ……. (2)
Here x (t) is the relative displacement of is mass and wn is its natural frequency. The steady state response of the system is given by
t
x(t) = (1/wn) ò -a(t)Sin wn (t-t)dt ….. (3)
0
The right hand side is known as Duhamel’s integral.[1]
Its relative velocity is given by
t
dx/dt = ò a(t)Cos(wt)dt …… (4)
0
The total energy per unit mass of the system, E(wn), at the end of time T can be written as the sum of the kinetic and the strain energies:
E (wn) = (1/2)[(dx/dt)2] +(1/2) wn 2x2(T) …… (5)
Substituting the values of x(T) and (dx/dt) in Equation (6) gives the relationship between E (wn) and FS (wn).
E (wn) = (1/2)[FS (wn)]2 …… (6)
Thus at the end of the strong motion the total energy per unit mass is one half of the square of the Fourier amplitude at that frequency. Expanding Equation (5), denoting the maximum relative velocity (spectral velocity) of the system SV (wn) and assuming that the maximum velocity occurs at time tv gives
tv tv
SV (wn) = [ ò a(t) Sin wntdt}2+{ò a(t) Cos wn tdt}2]1/2 ……. (7)
0 0
A comparison between equations (1) and (7) shows that, for zero damping the maximum relative velocity is equal to the Fourier amplitude when tv = T. If the maximum relative displacement SD (wn) occurs at time t = td, and a pseudo velocity PSV (wn) is defined as the product of the natural frequency and the maximum relative displacement, SD (wn),
PSV (wn) = wn. SD (wn) ……. (8)
It can, then, be seen that the pseudo velocity is equal to the Fourier amplitude if td = T. While SV (wn) and FS (wn) are closely related, in general, the Fourier amplitude is less than SV (wn) and PSV (wn). If w0 is the highest frequency in a(t) then the inverse Fourier transform relationship is written as:
w0
a (t) = (1/T)ò F(w)dw …… (9)
0
The intensity or total energy of a(t) is given by
T
I = ò a2 (t) dt ……. (10)
0
Using the Perseval’s theorem on Fourier transforms the intensity can also be written as
I =(1/p)ò[F (w)]2 dw ……. (11)
The intensity per unit time is, then, written as
T
G = (1/T) ò a2 (t) dt = =(1/pT) ò[F (w)]2.dw …. (12)
0
The right hand side represents the mean square vale of the acceleration, a(t).
In the frequency domain the power spectral density (PSD) is defined as
G (w) = (1/pT)[F(w)]2 ……. (13)
This gives the relationship between the PSD and the mean square acceleration r
w0
r = ò G (w) dw …… (14)
0
PSD is, normally, represented as the product of a normalized PSD function G<n>(w), which has a unit area under the w, G(w) curve, and a mean square acceleration. Thus
G (w) = r. G<n>(w)…. (15)
PSD is an important characteristic determining the frequency content of the accelerogram.
 |
 |
When the menu item Generate SCA is clicked a dialog box appears to allow the user to select the various parameters of the spectrum compatible accelerogram to be generated. The dialog box is shown here.
At least one spectrum compatible accelerogram is required for dynamic analysis of the structures and for generating response spectra for different floor levels. In the earlier days of aseismic design such accelerograms were obtained by modifying a recorded accelerogram (by suitably adjusting its time and amplitude scales). However, digital computers allow easy generation of synthetic accelerograms , and achieving a higher level of compatibility. A brief outline of the principle of generating spectrum compatible accelerograms is given below.
Any periodic function can be represented as a sum of sinusoids in the form:
X (t) = S An Sin (wnt+jn) ...... (1)
Here An is the amplitude and jn is the phase of the nth sinusoid. For fixed amplitudes An different ground motion time histories with similar appearances, but different details, can be generated. For X(t) the amplitudes An are related to the power spectral density (see Frequency content of accelerograms 5.3 ) of the time series at angular frequency wn by the following relationship:
G(wn).Dw = An2/2 ... (2)
As n becomes large the total power in the series is given by:
¥
òG (w). dw = SG(wn).Dw = S An2/2 ... (3)
0 n n
Equation (1) represents a stationary time series, in which the power does not vary with time. Earthquake signals are of transient nature. They have an onset, a rise time during which the signal builds up, duration of strong motion and, finally, a signal decay time in which the signal reaches the average ground level. The transient character of the strong motion signal can be simulated by multiplying X(t) with a window function I(t) describing the character of the transient. Thus the artificial ground motion time history can be written as:
a (t) = I (t). S An Sin (wnt + jn) .... (4)
n
Matching the response spectrum of the accelerogram with a target spectrum is done in several cycles by comparing the calculated response spectrum with the target response spectrum at selected frequencies[1] ,[2]. In the computation procedure the power spectral density (PSD) at the ith angular frequency is modified as follows:
G(w)i+1 = G(w)i . Sv(w)/Sv(i)(w) ... (5)
where Sv(w) is the spectral velocity in the target response spectrum, Svi(w) is the spectral velocity and G(w)i the PSD at frequency w in the ith iteration. G(w)i+1 is the modified PSD, for (i+1)th iteration, if another iteration is required. The following table lists out the frequency intervals in different frequency ranges, which have been recommended for comparing spectra for matching.
Table-
: Suggested Frequencies for calculation of Response Spectra.
|
FREQUENCY
RANGE |
INCREMENT |
|
0.5
– 3.0 |
0.1 |
|
3.0
– 3.6 |
0.15 |
|
3.6
– 5.0 |
0.20 |
|
5.0
– 8.0 |
0.25 |
|
8.0
– 15.0 |
0.50 |
|
15.0
– 18.0 |
1.0 |
|
18.0
– 22.0 |
2.0 |
|
22.0
– 34.0 |
3.0 |
Clicking the menu item “Spectral Shapes” opens the pop-up menu for generating response spectral shapes from a set of accelerograms.

The application reads acceleration data for ground motion time histories an ASCII from file, and computes fresh mean and mean + s (where s is the standard deviation) response spectral shapes. Subsequently the application is used to update spectral shapes by adding more accelerograms to the data set. The application has an option of generating as many time histories as specified by the user to generate the data set of accelerograms. Results of the computations are stored in various files created by keeping the usage in mind. At various stages of execution the user is informed, and given the option to change, the names of the output files.
